Introduction
U.S. parcel volume reached 22.37 billion shipments in 2024, with projections to hit 30 billion by 2030. Meanwhile, average delivery speed accelerated by 40%, dropping from 6.6 days in Q1 2020 to 4.2 days in Q2 2023. Yet last-mile delivery still accounts for 53% of total shipping costs.
Manually mapping shipping zones creates a bottleneck that inflates costs and delays fulfillment. The downstream effects show up fast:
- 48% of logistics operations report delayed package pickups
- 39% miss delivery windows
- 37% deal with missing or incomplete delivery details
These aren't driver errors. They're dispatch failures rooted in how zones get assigned.
Automation fixes this at the source. What follows covers how to set it up, what to get right before you start, and where most operations go wrong.
TL;DR
- Automate zone mapping using geospatial APIs and geocoding to programmatically define, assign, and update delivery territories based on real address data
- Five steps drive the process: geocode addresses, cluster demand geographically, draw polygon boundaries via API, attach zone constraints, then feed zones into route optimization
- Automation makes sense for high-volume operations, multi-depot networks, or dynamic demand patterns across large service areas
- Watch four variables closely: boundary precision, demand distribution, vehicle capacity rules, and how often you refresh zones
- Without route optimization integration, zone mapping alone delivers only partial gains — the two systems need to work together to move the needle
How to Automate Shipping Zone Mapping: A Step-by-Step Process
Step 1: Collect and Geocode Your Delivery Address Data
Automation begins with clean address data. Compile order origins, delivery destinations, and depot locations, then run them through a geocoding API to convert addresses into precise latitude/longitude coordinates.
What to validate at this stage:
- Flag addresses that fail geocoding (ambiguous, incomplete, or outside service area)
- Set validation rules to catch errors before they enter the zone assignment pipeline
- Verify coordinate accuracy, especially for rural or non-standard addresses
Approximately 8% of all domestic first-time deliveries fail, with address errors accounting for 45% of these failures. The average cost of a failed delivery in the U.S. is $17.20 per order.
Positional error in geocoding is significantly greater in rural and low-density areas compared to urban zones—garbage-in-garbage-out is the most common failure mode in automated zone systems.
Step 2: Analyze Demand Distribution and Identify Geographic Clusters
Before drawing any zone boundary, map historical order data spatially to identify delivery density hotspots, underserved areas, and natural geographic breaks (rivers, highways, admin boundaries) that should act as zone edges.
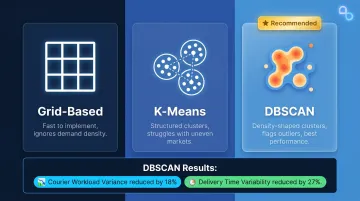
Common clustering approaches:
- Grid-based: Divides the service area into uniform cells — fast to implement, but blind to where demand actually concentrates
- K-means: Produces tidy, structured clusters, but breaks down in low-density or uneven markets
- DBSCAN: Shapes clusters around actual delivery density, handles irregular demand patterns, and flags outliers automatically
A study analyzing over 10 million deliveries found that DBSCAN reduced courier workload variance by 18% and delivery time variability by 27%, outperforming K-means across all metrics. Demand-weighted zone sizing (using iterative K-means that accounts for delivery volume within zones) yielded a 55.45% improvement in workload equality compared to purely geographic distributions.
Step 3: Define Zone Boundaries Using Geospatial APIs
This is where manual drawing is replaced by programmatic polygon creation. Using a geospatial API, define zone boundaries as GeoJSON polygons or geofences tied to the clusters identified in Step 2—boundaries can be drawn around ZIP code groups, drive-time isochrones, or custom shapes based on road network logic.
Conditions that must hold before saving zones:
- Each zone should be contiguous and non-overlapping with peer zones
- Zones must be sized to match realistic driver capacity (not just geographic preference)
- Boundaries should conform to road network realities (not cut across highways or industrial parks)
Isochrone-based boundaries account for turn penalties, one-way streets, truck restrictions, and barriers (rivers, rail lines, limited crossings) that coarse ZIP codes or radial circles ignore. ZIP Code Tabulation Areas (ZCTAs) are administrative boundaries that may form noncontiguous areas and don't reflect physical accessibility or true customer behaviour.
NextBillion.ai's Map APIs enable custom geofence creation and road-attribute-aware boundary logic, including truck-compliant routing and vehicle-specific restrictions.
Step 4: Attach Zone-Specific Operational Rules and Constraints
With zone boundaries in place, each zone needs operational rules before it can drive real dispatch decisions:
- Delivery time windows (same-day, next-day, or defined service hours)
- Vehicle eligibility — weight limits, truck restrictions, refrigerated requirements
- Maximum stop counts per driver per zone
- Service-level tiers (for example, Zone A = same-day, Zone B = next-day)
This is where automation often stalls in practice—zones are drawn but not parameterized, so the route optimizer has no zone-specific rules to enforce. The output is zone assignments that ignore operational reality.
NextBillion.ai's Route Optimization API supports 50+ hard and soft constraints, allowing zone-specific rules to be natively enforced during route generation. These include strict time-window constraints, priority-based routing (0–100 scale), dynamic scheduling for project-based tasks, and shift optimization to minimize overtime while maintaining service coverage.
Step 5: Integrate Zone Maps with Your Route Optimization Engine
Once zones are parameterized, the last step connects that zone layer to the routing engine. New orders arriving in the system are automatically classified and dispatched to the right driver pool—no manual sorting required.
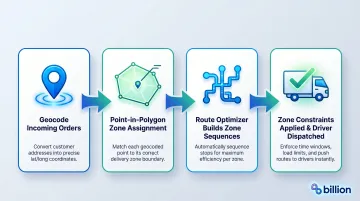
What this integration looks like:
- Incoming orders are geocoded
- Point-in-polygon checks assign them to a zone
- The route optimizer builds sequences within each zone boundary
- Zone-specific constraints (from Step 4) are applied during route generation
NextBillion.ai's Route Optimization API enables this automated workflow by accepting zone identifiers as constraints and enforcing zone-boundary containment, ensuring stops aren't assigned outside their designated zones. The platform also supports large distance matrix computation (up to 5000×5000 elements), enabling multi-depot routing scenarios that exceed the 25×25 limits common in other platforms.
When Does Automating Shipping Zone Mapping Make Sense?
Automation is not always the right fit. For small operations with a single depot and a stable service area, manually defined zones in a route planner are sufficient — and faster to maintain.
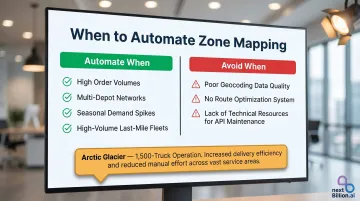
Operational triggers that justify automation:
- Order volumes that exceed what manual zone assignment can handle accurately
- Multi-depot networks where zones must be re-balanced dynamically
- Seasonal demand spikes that shift delivery geography week-to-week
- High-volume last-mile fleets where daily volume shifts make static zones a source of overload
Arctic Glacier, operating 1,500 trucks across 100+ facilities, transitioned from monthly/quarterly static territories to strategic route planning. They recreated master routes every 1-2 weeks to manage seasonal demand swings (dropping to 400 trucks in winter) and maximize fleet utilization.
That kind of scale demands automation. But for operations without the right infrastructure in place, the same tools can backfire.
Risk factors that undermine automation:
- Geocoding data quality is poor
- No route optimization system exists to consume the zone output
- The operation lacks technical resources to maintain API-driven zone updates
In these cases, automated zone updates produce outputs that no downstream system can act on — creating noise instead of efficiency.
What You Need Before You Start Automating
Preparation quality directly determines automation outcomes. Teams that attempt to automate zone mapping without these inputs typically produce zones that look correct on a map but fail operationally.
Geospatial and Address Data Infrastructure
Minimum data requirements:
- A geocoding API capable of handling your service region accurately (including rural or non-standard addresses)
- Historical order data with timestamps and geocoordinates
- Depot/warehouse locations expressed in precise coordinates
NextBillion.ai's Geocoding API converts addresses into geographic coordinates with support for complex logistics operations, integrated with their Route Optimization, Directions, and Distance Matrix APIs. That geocoding foundation only delivers full value when the routing layer can actually consume and enforce the zones it produces.
Route Optimization System Compatibility
Zone automation is incomplete without a compatible route optimizer to act on the boundaries you define. The routing engine must:
- Accept zone identifiers as a constraint
- Enforce zone-boundary containment
- Handle constraint types (time windows, vehicle type, load limits) attached to each zone
NextBillion.ai's platform handles mixed-vehicle fleets, liftgate requirements, height/weight/cargo restrictions, and time- or vehicle-based road access rules. These constraints map directly to zone-to-vehicle assignment logic, so routes stay compliant without manual overrides.
Technical and Operational Readiness
What the ops team needs to agree on before building automation:
- Service area coverage rules
- Number of zones and rough sizing criteria
- Which order attributes determine zone eligibility
- Who owns zone boundary updates when demand patterns shift
Key Parameters That Affect Zone Mapping Accuracy and Delivery Speed
Even well-architected automation produces poor delivery outcomes if these control variables aren't correctly configured.
Geographic Boundary Precision
Zone boundaries defined by ZIP code groupings alone introduce artificial edges that don't reflect road network realities. A boundary that cuts across a highway or industrial park will assign stops incorrectly and generate route backtracking.
Polygon-based boundaries built on road-network or drive-time logic produce tighter, more operationally realistic zones that reduce average stop-to-stop distance. In a Ninja Van case study, automated zoning was revised to align with geographical boundaries such as main roads and rivers to maintain operational efficiency.
Order Demand Distribution
Zones sized purely by geographic area without weighting for order density create imbalanced driver workloads — dense urban zones become overwhelming while sparse suburban zones leave drivers underutilized.
Demand-weighted zone sizing corrects this. Uneven distribution of delivery tasks drives overtime, hurts driver morale, and raises the risk of workplace accidents. Automated zoning at Ninja Van reduced total work span by 6.6% and individual driver delivery times by 3.5%.
Vehicle and Capacity Constraints per Zone
If zone boundaries don't account for the vehicle types that serve them — truck-restricted roads in dense zones, refrigerated vehicles for certain routes — drivers encounter stop-level exceptions the automation didn't anticipate.
Embedding zone-to-vehicle matching at the zone definition stage eliminates that class of dispatch errors and reduces failed deliveries caused by vehicle unsuitability.
Zone Refresh Frequency
Static zones drift from actual demand patterns within weeks. Customer growth, seasonal shifts, and new depot openings all change the optimal zone structure — yet most operations define zones once and leave them untouched.
Research on traffic variability and shifting demand shows how significant that drift becomes:
| Condition | Static Routing | Dynamic Routing |
|---|---|---|
| Performance degradation (extreme variability) | 26.2% | 15.1% |
| On-time delivery drop (traffic disruption) | 28.4% | 6.8% |
| Maximum delay spike | 34.7 minutes | 8.2 minutes |
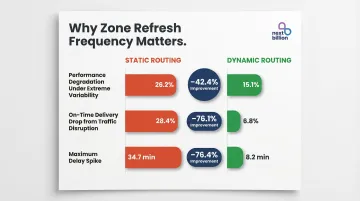
Operations that re-optimize zone boundaries on a scheduled cadence — monthly, quarterly, or triggered by order volume thresholds — maintain route efficiency over time rather than experiencing that gradual degradation.
Common Mistakes When Automating Shipping Zone Mapping
Four mistakes consistently derail zone automation projects — and most of them happen before a single route runs.
- Define zones from order data, not map boundaries. Many teams draw zones using ZIP codes or city limits instead of analyzing actual order flow. The result looks logical on a map but performs poorly under real routing conditions.
- Build zone review into the workflow from day one. Zones deployed and left static drift out of alignment with demand within months. Without a scheduled review process, efficiency losses compound quietly until someone notices the routes are broken.
- Connect zone maps directly to the routing engine. Zones that exist as a standalone data artifact — separate from route optimization — force dispatchers to apply zone logic manually, which defeats the purpose of automation entirely. Gartner data shows 76% of logistics transformations fail to meet their core KPIs, and poor clustering and zoning alone can add 25–30% annually to last-mile costs.
- Handle geographic edge cases explicitly. Addresses on zone borders, non-contiguous polygons (islands, disconnected neighborhoods), and zones crossing road network gaps all need defined rules. Left unaddressed, automated systems either assign stops incorrectly or fail silently — both outcomes are hard to diagnose after the fact.
Frequently Asked Questions
What is the difference between shipping zones and delivery zones?
Shipping zones (used by carriers like USPS, FedEx, and UPS) are carrier-defined geographic tiers that set package pricing and transit times based on distance from the origin point. Delivery zones are internally defined territories that logistics teams create to organize driver assignments, route groupings, and service-level rules within their own network.
Can shipping zone mapping be automated without geospatial APIs?
Basic automation using ZIP code lists and spreadsheet logic works for simple, stable service areas. For multi-depot, high-volume, or time-sensitive operations, a geospatial API is required — it translates addresses into coordinates, performs point-in-polygon checks, and builds boundary shapes that reflect actual road network conditions.
How often should automated shipping zones be updated?
Most operations benefit from a scheduled quarterly zone review. Trigger additional reviews when order volume in a zone shifts beyond defined thresholds, or when new depots or service areas come online.
What data inputs are required to automate shipping zone mapping?
You need three core data inputs: geocoded delivery address history (to understand demand distribution), depot or origin coordinates (to anchor zone geography), and operational parameters — vehicle types, time windows, and capacity limits — that govern rules within each zone.
How does automated zone mapping directly improve delivery speed?
Automation eliminates the manual dispatch step of assigning orders to zones and reduces backtracking by keeping stops geographically consolidated. This lets the route optimizer build tighter sequences, cutting time-per-stop and fitting more deliveries into each shift.
What are the risks of poorly defined shipping zones?
Key failure modes include driver workload imbalance, geographic backtracking that inflates fuel cost and delivery time, incorrect stop assignments for addresses near zone borders, and customer experience degradation when ETAs based on zone assumptions don't match actual travel conditions.